

Introduction
By the International Commission on Illumination (CIE) to develop, so called CIE chromaticity map. Describe the color quality of a comprehensive indicator known as color, color with the following three attributes to describe:
1.color. The dominant wavelength of light in the shade is called the dominant wavelength, and the subjective color perception is determined by the dominant wavelength of light.
2.brightness. The degree of subjective brightness determined by the energy of the colored light.
3.saturation. Describe the proportion of the pure spectral color in a component of a color, that is, the purity of the color. Spectral colors caused by monochromatic light are considered to be very pure colors and are visually known as high saturation colors. Monochromatic light mixed with white when the purity is reduced, the corresponding decrease in saturation. For example, the wavelength of 650 nm is very pure red shade, a certain amount of white light to join, the result of mixing pink, adding more white, the more mixed the color is not pure, the smaller the visual saturation.
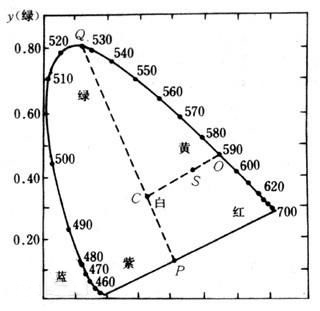
The picture shows the CIE chromaticity diagram, in which the x coordinate is the proportion of the red primary color, the y coordinate is the proportion of the green primary color, and the coordinate z representing the blue primary color can be derived from x + y + z = 1. The points on the arc represent pure spectral colors, and this arc is called the spectral trace. A straight line from 400 nm (violet) to 700 nm (red) is a purple-red color series (non-spectral color) that is not on the spectrum. Center point C on behalf of white, equivalent to the color of the sun at noon, the chromaticity coordinates x = 0.3101, y = 0.3162. Chromatic map of the office to a point S, you can immediately get the S-point represents the color of the color tone and saturation. Link CS, the extension of the line cross-spectral trajectory at O, O at the wavelength that is the color of the dominant wavelength of S, determines the color S tone. The distance from C to S and O is the distance between CS / CO and the saturation of the color. From any point on the spectral trajectory through the C point of a straight line to reach the contralateral spectral trajectory on another point, then the color of the line ends complement each other. From a point on the straight line representing the non-spectral color series, a straight line is drawn through the point C, and the intersection of the spectral trace at point Q and color Q is the complementary color of the non-spectral color at point P. The non-spectral color is represented by adding a letter c after its complementary wavelength, for example, 528c for a green complementary color with a wavelength of 528 nm, or magenta. When any two colors are mixed, the color point of the mixed color must be on the line connecting the first two color points. From the color chart can be seen, red, green, blue three colors can be synthesized in any color. CIE chromaticity diagram has great practical value, any color, whether it is light color or surface color, can be calibrated in the chromatic map out, which makes the color description is simple and accurate, the synthesis of colored light path is also clear. In order to ensure the correct identification of color, CIE published in 1983, "visual signal surface color" standard, the document in the CIE chromaticity diagram on the visual signal surface color provides a specific range.